

Support
Mobile Trading App
Download

Blogs About Trading
Technical Analysis: USOIL
26.03.2025
USOIL reached a 3-week high
On Wednesday, USOIL climbed slightly. It was around the US$70 mark and reached a 3-week high at one point.
US imposed tariffs on Venezuelan oil imports
On the 24th March, local time, the US placed a 25% tariff on all imports from any country that buys oil from Venezuela, raising concerns on short oil supply around the world.
US API crude oil inventories declined
US API crude oil inventories (during the week ending on the 21st March) fell from 4,593 thousand barrels to -4,599 thousand barrels Vs. -1,074 thousand barrels (forecast), according to the data from API.
The bullish market trend prevailed in the short term
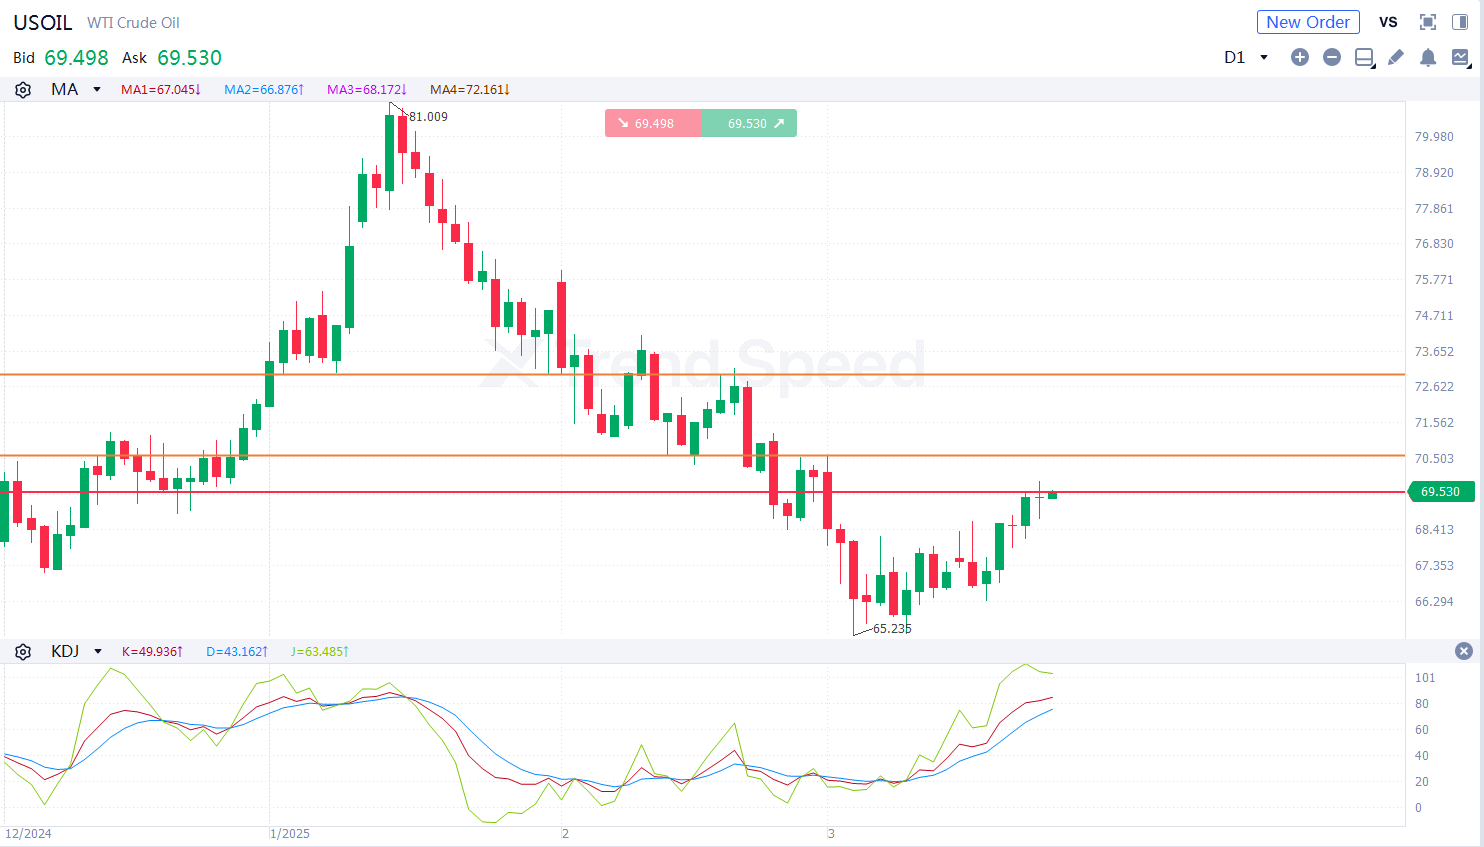
the Chart of the Day
On the chart of the day, USOIL was prone to fluctuation and climbed. The bullish market trend prevailed. In terms of technical indicators, KDJ went upwards after golden cross occurred, showing that USOIL will rise further. Investors should focus on whether USOIL will break through the resistance at 70.6. It will rise further with potential resistance at 73.0 if it breaks above 70.6.
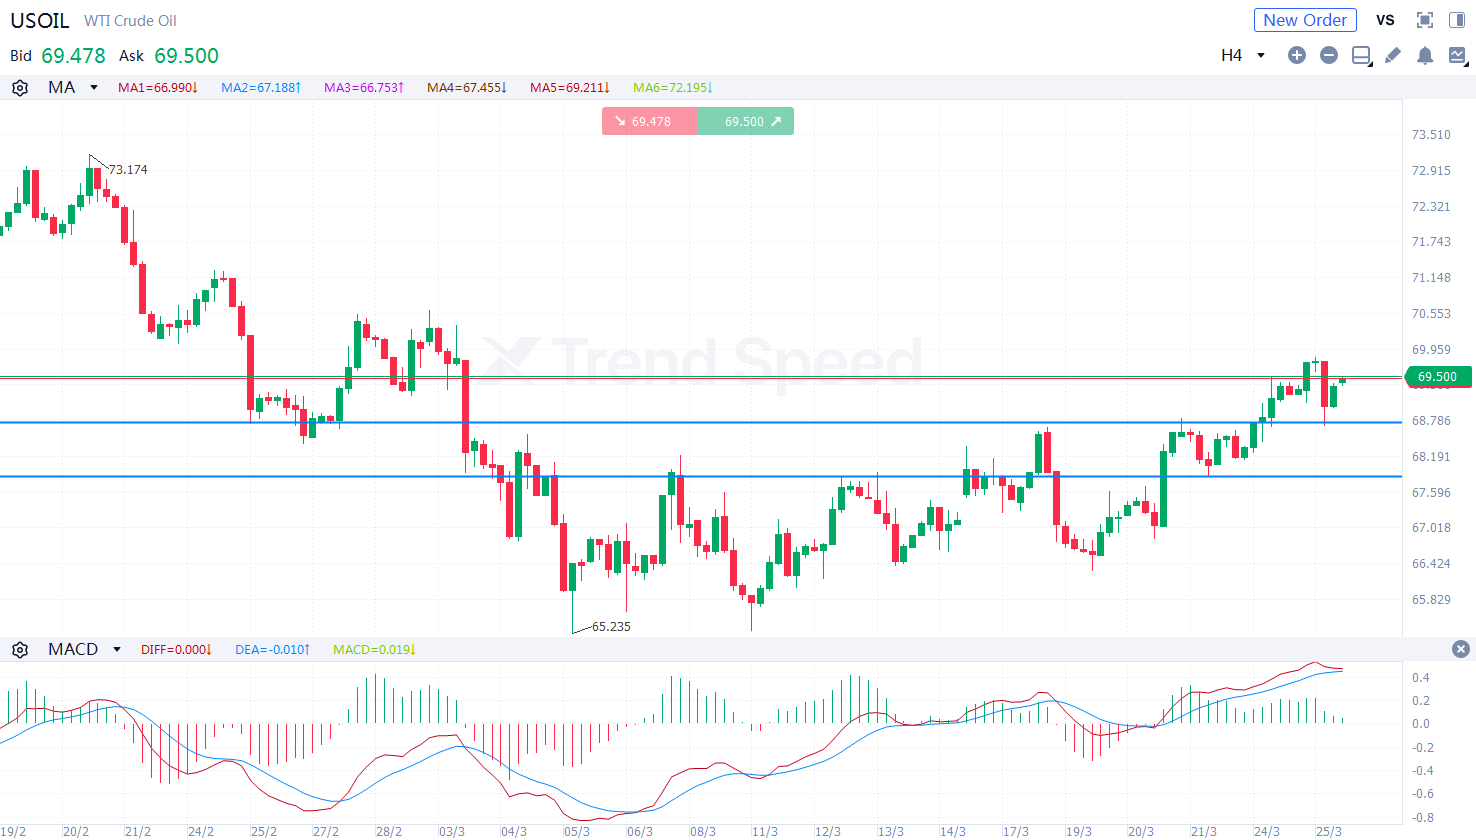
4-hour chart
On the 4-hour chart, USOIL was prone to fluctuation and climbed. The bullish market trend prevailed. In terms of technical indicators, MACD went upwards after golden cross occurred, showing that the bullish market trend prevailed. Investors should focus on whether USOIL will break through the support at 68.7. It will continue rising if it retreats but is stable above 68.7.
Key resistance: 70.6,73.0
Key support: 68.7,68.0
Generally speaking, USOIL is more likely to jump further in the short term. Investors should focus on US EIA crude oil inventories during the day.
Hot
Technical Analysis: GBPUSD
27.03.2025
Technical Analysis: XAUUSD
01.04.2025
Technical Analysis: XAUUSD
17.04.2025
Technical Analysis: XAUUSD
08.04.2025
Technical Analysis: XAUUSD
22.04.2025

Mobile Trading App

AFA REGIONAL SPONSOR
AFA REGIONAL SPONSOR
Markets
Analysis
Education
Trade
More
 Trading Central
 Argentine Football Association
 Visa/Mastercard
Online trading is complex with high risks. Please invest cautiously.