

Support
Mobile Trading App
Download

Blogs About Trading
Technical Analysis: XAUUSD
14.01.2025
XAUUSD fell 1%
On Monday, XAUUSD fell more than $30 from its intraday-high. It ended down 1.02% at $2,662.51 per ounce.
The USDX hit a new high in more than two years
On Monday, the USDX once rushed above the 110 mark during the session, hitting a new high since November 2022.
Gold ETF holdings declined
As of January 13, 2025, the world's largest gold ETF, SPDR Gold Trust, held 874.53 tons of gold, a decrease of 2.29 tons from the previous trading day
Technically speaking, there is a need for a correction in the short term
 the Chart of the Day
On the chart of the day, XAUUSD closed down significantly yesterday, and there is a need for a correction in the short term. In terms of technical indicators, KDJ fell after the death cross, showing XAUUSD will fall further. Investors should focus on whether XAUUSD will break through the support at 2655. It will fall further with potential support at 2639 if it breaks below 2655.
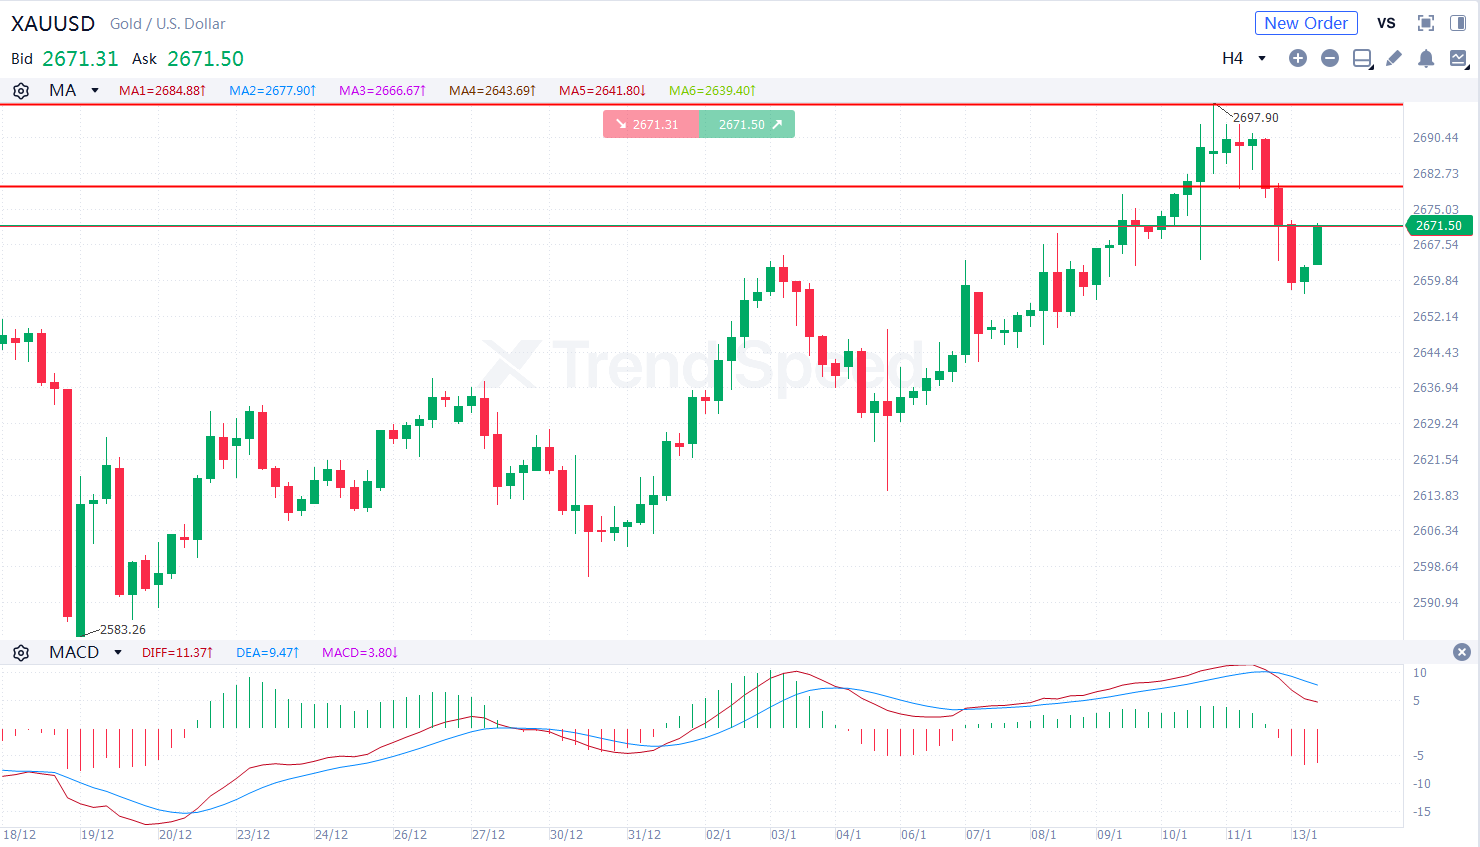 4-hour chart
On the 4-hour chart, XAUUSD fell from highs. The bearish market trend prevailed. In terms of technical indicators, MACD fell after the death cross, showing that the market trend is bearish. Investors should focus on whether XAUUSD will break through the resistance at 2680. It will fall further if it rebounds but is capped at 2680.
Key resistance: 2680,2698
Key support: 2655,2639
Generally speaking, XAUUSD is more likely to correct in the short term. Investors should focus on the US PPI data during the day.
Hot
Technical Analysis: AUDUSD
18.03.2026
Technical Analysis: USDJPY
25.02.2026
Technical Analysis: EURUSD
26.02.2026
Technical Analysis: USOIL
04.03.2026
Technical Analysis: XAUUSD
24.02.2026

Mobile Trading App

AFA REGIONAL SPONSOR
AFA REGIONAL SPONSOR
Markets
Analysis
Education
Trade
More
 Trading Central
 Argentine Football Association
 Visa/Mastercard
Online trading is complex with high risks. Please invest cautiously.