

Support
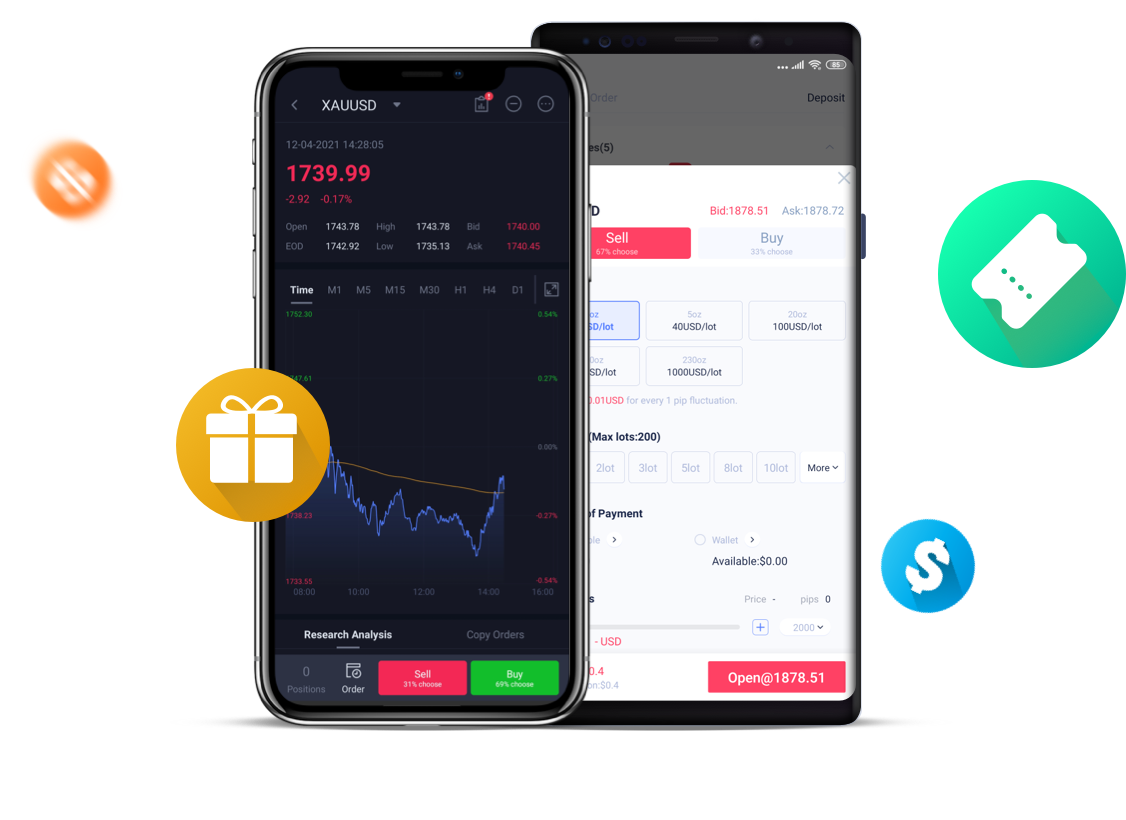
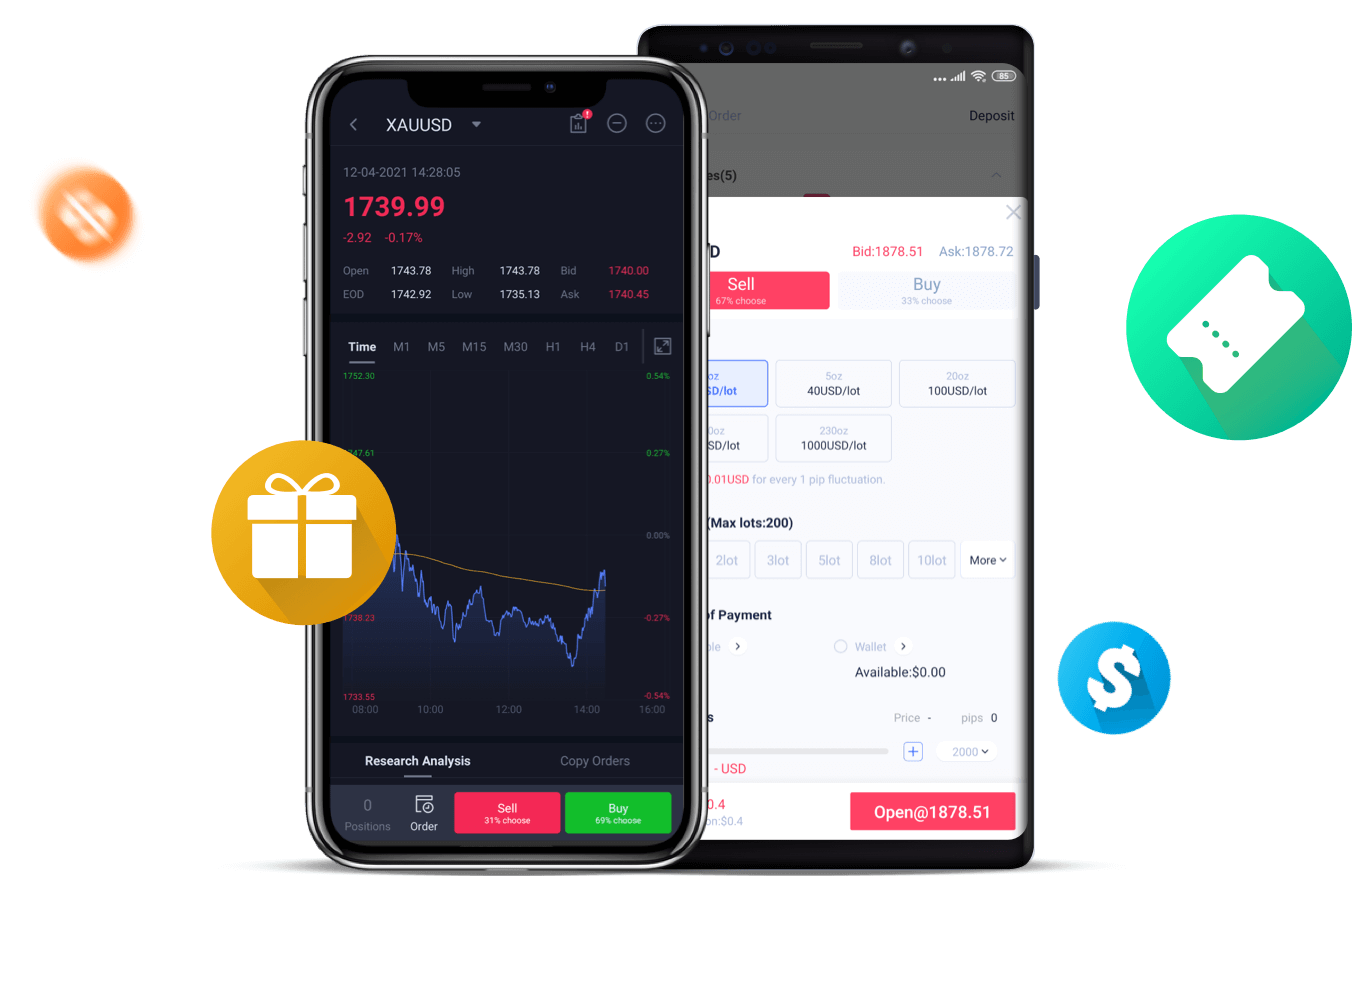
Mobile Trading App
Download
Markets![]() Commodities
Commodities
- Price

- Ideas
- Signal
- Chart
- About Market
Markets![]() Commodities
Commodities
Commodity chart with technical indicators shows the real-time prices of commodities such as gold/silver/crude oil, as well as historical and current price trends. A commodity price chart can let traders view the market trend of each commodity intuitively. There are a bunch of functions for traders, such as market charts (Bars, Candles, Hollow Candles, Heikin Ashi, Line, Area, and Baseline), cycle analysis (minutes, hours, days), and more than 100 technical indicators on the commodity chart. XTrend Lite provides free commodity trading charts for investing charts commodity futures.
NICKEL
NICKEL
NICKEL
NICKEL
Mobile Trading App
Past performance is not an indication of future results.
No Data

Mobile Trading App

AFA REGIONAL SPONSOR
AFA REGIONAL SPONSOR
Markets
Analysis
Education
Trade
More
 Trading Central
 Argentine Football Association
 Visa/Mastercard
Online trading is complex with high risks. Please invest cautiously.