

Support
Mobile Trading App
Download

Blogs About Trading
Technical Analysis: XAUUSD
28.01.2025
XAUUSD fell more than 1%
On Monday, XAUUSD fell more than $30 from its intraday-high. It ended down 1.02% at $2,662.51 per ounce.
Investors sold gold positions to cash in
On Monday, the broader U.S. market decline caused by the shocking attack of Chinese artificial intelligence startup DeepSeek prompted investors to sell gold positions to cash in.
Gold ETF holdings decreased
As of January 27 (Monday), the world's largest gold exchange-traded fund (ETF) SPDR Gold Trust held 857.02 tons of gold, down 3.15 tons from the previous trading day.
Technically speaking, there is a need for a correction in the short term
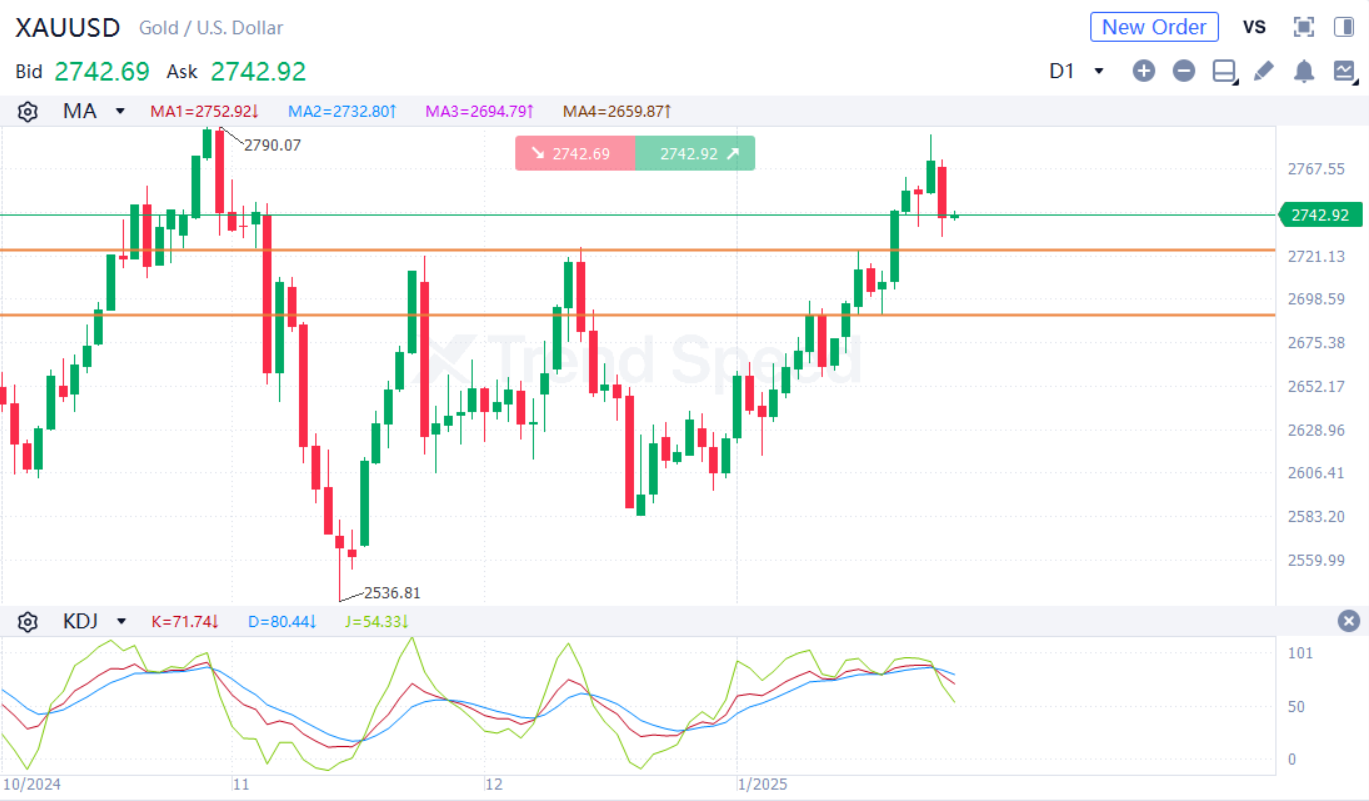 the Chart of the Day
On the chart of the day, XAUUSD fell from highs, and there is a need for a correction in the short term. In terms of technical indicators, KDJ fell after the death cross, showing XAUUSD will fall further. Investors should focus on whether XAUUSD will break through the support at 2725. It will fall further with potential support at 2690 if it breaks below 2725.
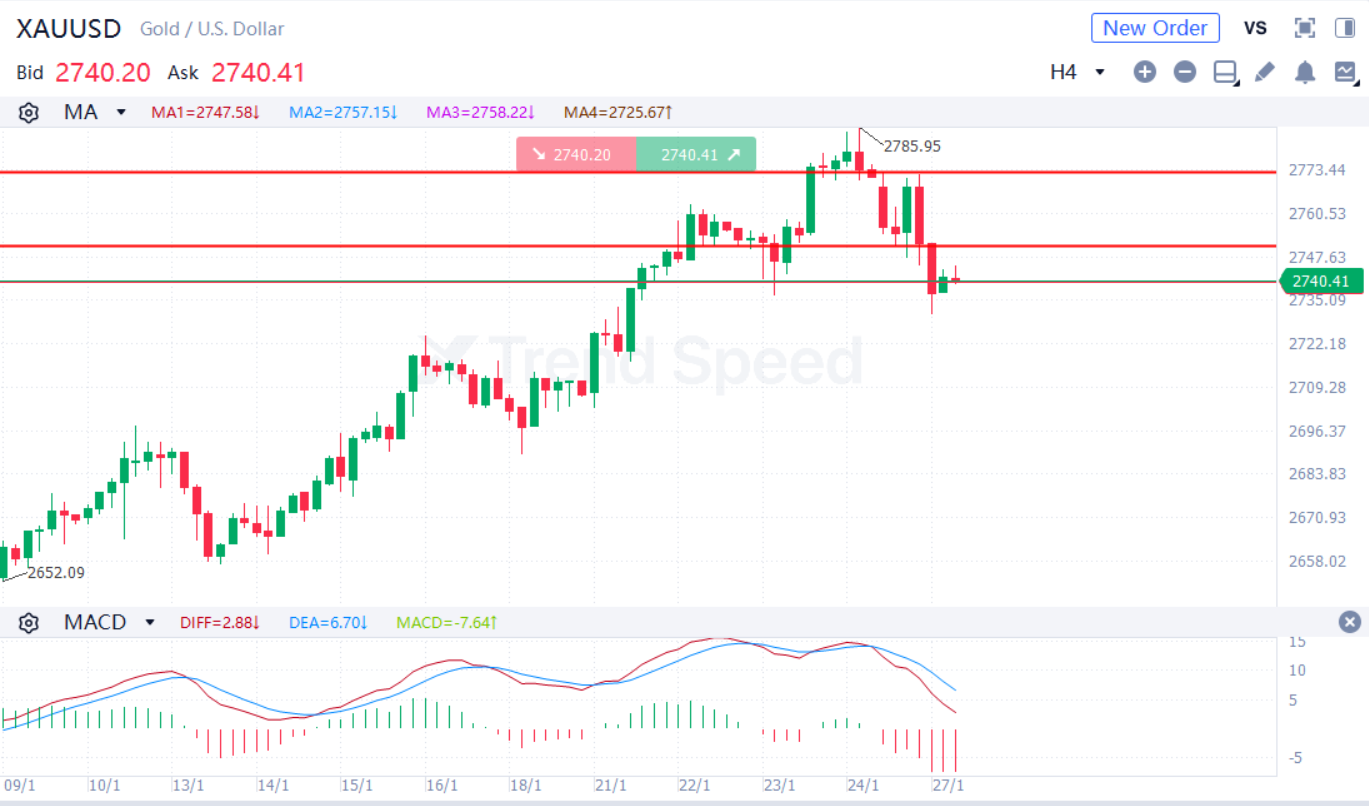 4-hour chart
On the 4-hour chart, XAUUSD fluctuated and fell. The bearish market trend prevailed. In terms of technical indicators, MACD fell after the death cross, showing that the market trend is bearish. Investors should focus on whether XAUUSD will break through the resistance at 2750. It will fall further if it rebounds but is capped at 2750.
Key resistance: 2750,2772
Key support: 2726,2690
Generally speaking, XAUUSD is more likely to correct in the short term. Investors should focus on US economic data during the day.
Hot
Technical Analysis: USDJPY
25.02.2026
Technical Analysis: AUDUSD
18.03.2026
Technical Analysis: EURUSD
26.02.2026
Technical Analysis: USOIL
04.03.2026
Technical Analysis: XAUUSD
24.02.2026

Mobile Trading App

AFA REGIONAL SPONSOR
AFA REGIONAL SPONSOR
Markets
Analysis
Education
Trade
More
 Trading Central
 Argentine Football Association
 Visa/Mastercard
Online trading is complex with high risks. Please invest cautiously.