

Support
Mobile Trading App
Download

Blogs About Trading
Technical Analysis: USDCAD
27.02.2025
USDCAD reached a two-week high
On Wednesday, USDCAD climbed for the 4th straight trading day to the highest level since the 10th February.
Canada may sink into an economic slump
Trump’s 25% tariff plan may make Canada sink into the worst economic slump since 1992, and we will take at least two years to recover the economy, the Bank of Canada Governor Tiff Macklem warned recently.
The USDX rebounded slightly
On Wednesday, boosted by Trump’s recent statements, the USDX rebounded slightly and was above an 11-week low.
The bullish market trend prevailed in the short term
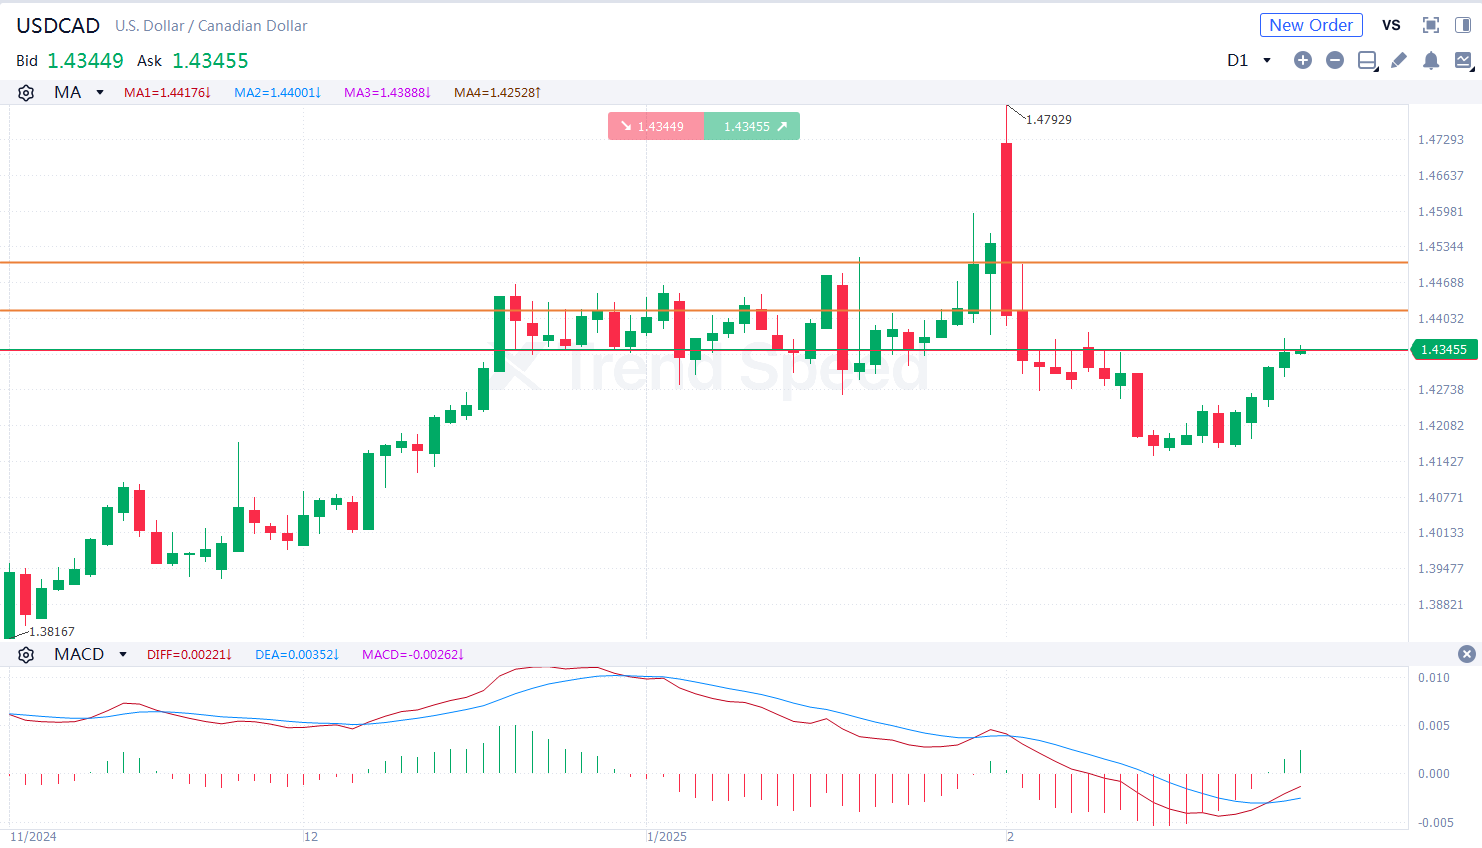 the chart of the day
On the chart of the day, USDCAD was prone to fluctuation and climbed. The bullish market trend prevailed in the short term. In terms of technical indicators, MACD went upwards after golden cross occurred, showing that USDCAD will rise further. USDCAD will jump with potential resistance at 1.450 if it breaks above 1.442.
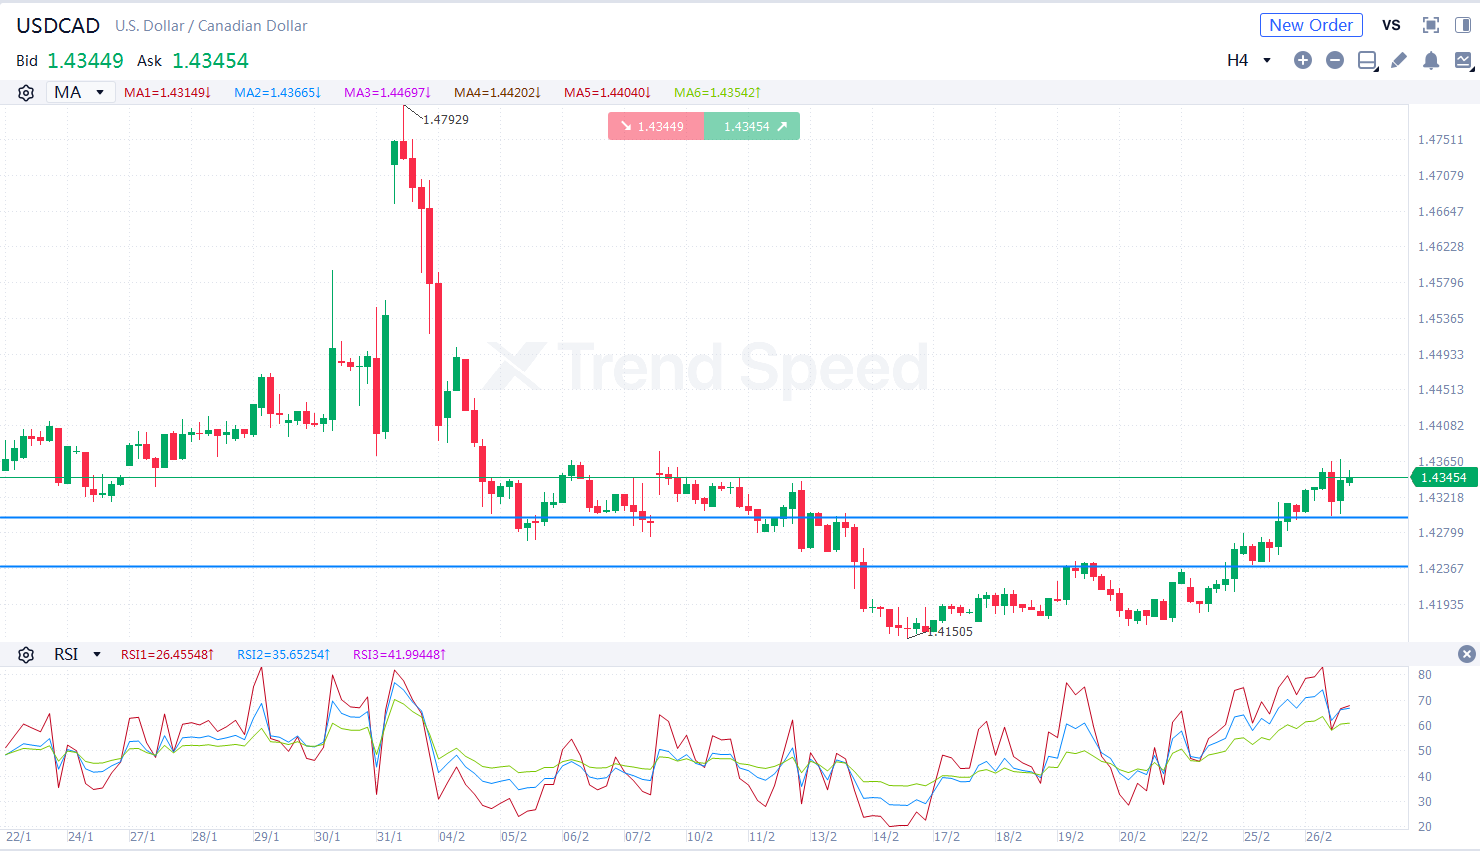 4-hour chart
On the 4-hour chart, USDCAD was prone to fluctuation and climbed. The bullish market trend prevailed. In terms of technical indicators, RSI witnessed golden cross at a high level, showing that the market trend is bullish. Investors should focus on whether USDCAD will break through the support at 1.430. It will climb further if it retreats but is stable above 1.430.
Key resistance: 1.442, 1.450
Key support: 1.430, 1.424
Generally speaking, USDCAD is more likely to rise further in the short term. Investors should focus on US economic data during the day.
Hot
Technical Analysis: AUDUSD
26.03.2026
Technical Analysis: EURUSD
24.03.2026
Technical Analysis: XAUUSD
01.04.2026
Technical Analysis: USDCAD
25.03.2026
Technical Analysis: EURUSD
08.04.2026

Mobile Trading App

AFA REGIONAL SPONSOR
AFA REGIONAL SPONSOR
Markets
Analysis
Education
Trade
More
 Trading Central
 Argentine Football Association
 Visa/Mastercard
Online trading is complex with high risks. Please invest cautiously.